

People spend 90% of their time inside a building – be it our homes, offices, schools, colleges, workplaces, etc. This makes it imperative to make buildings healthy and improve our health, comfort, and productivity through operational and design strategies. Imagine it’s a hot day outside, you take out a cold can of soda from the refrigerator. Within a few minutes, water droplets form on the can – this phenomenon is called condensation. The temperature at which condensation begins is called the dew point. Psychometric charts can be used to predict this dew point temperature.
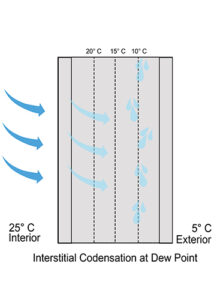
This brings us to this article – simulating moisture control in resilient building envelopes. A similar situation occurs in the building envelopes – the outdoor temperature is 5ºC and the indoor temperature is being maintained at 25ºC. There will come a point when air diffuses from the warm interior of a building to the cool exterior and reaches its dew point within the construction of the building, turning water vapor into droplets. This is called interstitial condensation.
Building interstitial condensation can cause mold growth, staining, corrosion, the poor performance of insulation, damage to equipment and electrical failure. It may affect the integrity of building materials and structures. Mold and mildew within buildings lead to increased concentration of organisms such as bacteria, termites, insects, etc.
Another major issue caused by this is “Sick Building Syndrome” which started during the energy crisis of the 1970s. Designers increasingly began to employ methods to reduce energy consumption to increase energy efficiency in buildings. This led to building designs including weather stripping doors, insulated double or triple-pane windows, increased insulation and building wraps without testing the impact of these additional insulation materials on the dew point of the wall sections.
Some thumb rules to mitigate condensation are:
- Vapour barriers to be located on the warm internal side of the construction in cooler damper climates
- Ensuring buildings are adequately ventilated
- The thickness of insulation to be carefully selected to meet various building codes There are many ways to measure the condensation risk beforehand using innovative software and technology.
Using WUFI to measure condensation risk during early phases of Design
WUFI is a software capable of calculating heat and moisture transport in walls and other multi-layer building components exposed to natural climatic conditions.
WUFI takes the following components into account to assess condensation risk:
- Materials assembly (construction and material parameters) including R-value, thickness, type of material, conductivity, etc.
- Building orientation, inclination, and height
- Surface transfer coefficients (comprising of the surface transfer properties for the exterior and interior surface)
- Initial conditions (initial distributions of moisture and temperature)
- Calculation period/profiles (duration of simulation)
- Outdoor climate (pulled from weather files loaded into the software)
- Indoor climate (interior environmental information from the HVAC systems)
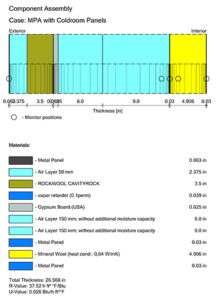
Several databases are available globally for determining building material parameters. In addition, WUFI has the capability to create project-specific materials and determine the overall R-value of the wall section. Monitor position is the location at which the temperature of the external assembly is measured. At the beginning of a project, testing multiple monitor positions for each wall section is recommended to find out the weaker points.
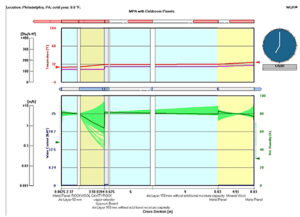
The graphs in Figure 3 portray the monitor position temperature and the dew point of the assembly at a specific location and time. This graph is an important tool to understand the simulation by providing information on when the test assembly will fail and have condensation. When the temperature through the wall section (red line) intersects the dew point of the assembly (purple line), condensation will occur.
Ideally, the temperature should always be more than the dew point at all points to prevent condensation. Special care must be taken to understand the location of the monitor position. For example, if the monitor position is outside of the vapour barrier and the temperature line intersects the dew point line, then this condensation does not pose a risk for building degradation since it will be drained out.
BioPharma Facility with Cold Rooms
The first step during this analysis is to identify the numerous scenarios that could pose a condensation risk. For this project, the design team tested more than 20 different sections throughout the exterior façade of the building. Figure 3 shows the Temperature vs. dew point graph for the rain screen façade and modular construction system at the cold room on the south wall of the building.
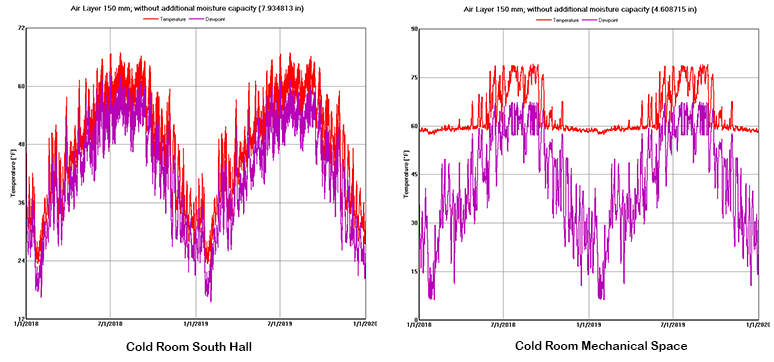
The monitor position for this graph lies within the air space between the two constructions. As shown in the graph the air space will have condensation over a period of time, degrading the building materials around it. While testing other wall sections, the project team saw this problem occurring only at one location outside the cold room wall. The wall section at the cold room mechanical space on top of it did not show any possibility of condensation.
This proved that the exterior rain screen façade was well designed to mitigate condensation and the low temperature of the cold room was causing this issue. This issue was the genesis of another idea – ventilating the cavity with the same temperature as the cold room mechanical spaces, which will prevent the air space from getting cold enough to reach the dew point temperature. To check the feasibility of the idea, the ventilated cavity solution was tested out in different joint conditions around the cold room. Even if more insulation was added to the building, the ventilated cavity in the cold room did not show any signs of condensation.
In summary, the project team was able to find a deficiency in the composite wall system of the cold room through simulation, provided a viable solution in the form of a ventilated cavity that would prevent improper moisture intrusion and demonstrated the results of this new design through simulation.

Using LADYBUG Tools to measure condensation risk in complex wall sections
Ladybug tools in collaboration with Therm (LBNL) allow the testing of non-continuous wall sections, involving multiple materials. Drawings in this software are customisable and help determine the thermal bridges of the assembly. On the other hand, Therm provides a range of building materials for running the analysis and also provides an option to create new materials.
The simulation is a simple 4-step process and uses Rhino, Grasshopper, Ladybug tools, and Therm:
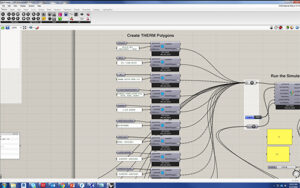
Step 1: Import the section detail from AutoCAD/Revit or Draft it in Rhino. Ensure all materials are closed poly surfaces. Alternatively, create a parametric model within Grasshopper and test multiple iterations.
Step 2: Assign materials to surfaces in Grasshopper from default Therm materials or create your own.
Step 3: Import climate data from the weather file to create external boundary conditions and input internal boundary conditions such as set point temperature, and relative humidity.
Step 4: Run the simulation. Ensure that the legend and colors are assigned such that all options have the same parameters.
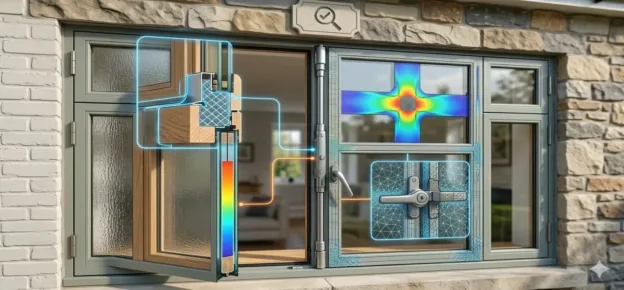
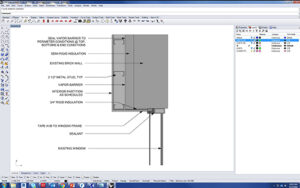
Retrofitting an Existing Strip Window
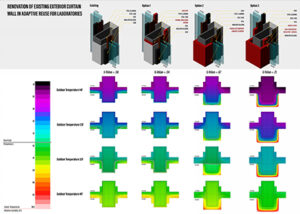
Figure 8 is a comparative representation of different window sections and the effect of environmental factors on them, in a historically significant mid-century modern building. It portrays window section options in isometric view and envelope heat transfer through those options at different winter month temperatures. It also depicts the risk of condensation in each option with effective U-Values of construction.
This analysis was aimed at understanding what happens to renovated laboratory spaces in an existing building, whether differing humidity levels would lead to condensation, and how to reduce energy loss through the exterior enclosure while maintaining the minimal vertical mullions. Rhino was used for modelling and rendering the mullion detail sections, while Therm combined with Ladybug-Honeybee for envelope heat modelling and condensation risk analysis. Post-simulation was done using Photoshop and Bluebeam. The study shows the different options in one graphic for ease of comparison between environmental factors and visual aesthetics.
Comparison of WUFI vs. Ladybug/Honeybee/Therm
Both case studies help us understand the importance of such analysis and the capabilities of the software used. Ladybug tools are preferred when analysing complex wall section details since they are flexible and can test multiple transitions in materials. Ladybug tools are open source and available to all for use. On the other hand, WUFI is considered appropriate for early design stages and multi-season analysis since it is easier to use and provides dynamic results, although cost can be a deterring factor.